Practical example: Cluster Analysis
Objective
An automobile manufacturer wished to enhance the efficiency of his marketing activities by addressing his potential customer groups in a more targeted way.
Segmentation was carried out in order to indicate whether certain recognizable driver types exist, and how such types could be described.
Analysis
It was decided to use attitudes to driving as the characterization criteria for the typologies. The following attitudes were defined and queried in the framework of a survey of the target group:
- I prefer leisurely driving
- I like driving with an open top
- My car must be environment-friendly
- I like driving a car that stands out from others
- I like driving fast
- My car must reflect my personality
- Modern technology makes driving easier
- My car must be comfortable
- My car must be safe
- I depend on my own abilities
- Electronics makes driving safer
A cluster analysis was carried out to show whether any groups existed who shared similar attitudes but differed significantly from other groups.
A two-stage procedure was adopted. In the first stage, a hierarchical cluster analysis was carried out. The groupings formed in different merging steps were then used as the starting partition for a partitional cluster analysis.
This two-stage approach has the advantage that the strengths of the individual procedures can be used while their weaknesses can be largely avoided. The hierarchical cluster analysis delivered starting partitions for the partitional analysis based on it. This guaranteed unambiguous solutions on the basis of meaningful starting points. The partitional analysis, in turn, guaranteed an optimal categorization, because the results are continually re-sorted until no further improvement is possible.
In order to find segments that would be most operationally relevant, solutions based on 2 to 8 clusters were calculated and their content analyzed.
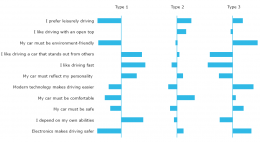
It was decided in favor of the 3-cluster solution, which produced very clearly-defined driver types with clear differentiations from one another. The following Figure shows the profiles of these 3 clusters in terms of the 11 attitudes queried.
It is important to note that such tables contain relative, not absolute, values. They show deviations from the overall average. A bar to the left of the central line indicates that the subgroup is less in agreement with the statement than the sample as a whole. But this does not necessarily mean that the subgroup does not have a high level of agreement with the statement.
The 3 clusters can be described as follows:
- They like to drive fast and feel they can depend on their own abilities. They have a strong identification with their car.
- Comfort is important to this group. They enjoy driving, but they are less concerned with speed and more interested in leisurely and comfortable driving.
- Safety is important to this driver type. They feel they can rely on the technology. They are also environmentally conscious. This may have to do with a generalized sense of security.
There is no limit to the creativity that can be used in labeling the groups thus discovered. Depending on the topic and survey objectives, the labels chosen can be sober and factual or bold and striking.
In the case under discussion, the types could be designated as “Speed-oriented”, “Comfort-oriented” and “Safety-oriented”.
The objective of the optimization process is to find groups whose members are as similar as possible. Each group, by contrast, should differ as much as possible from other groups. Significance tests can be used to test how far this is the case. Such tests use precisely the two above-mentioned criteria. The smaller the variance within the group, and the larger the difference to the other groups, the more the differences between the groups can be considered as significant.
In the case under discussion, an analysis of variance showed that, for all items with the exception of “I like driving with an open top”, the mean differences between the groups were significant with a probability of error of less than 5%.
Analyzing the clusters in terms of further descriptive features helps to round out the picture of the respondent types in each subgroup. For example, the average age and gender split of our 3 driver types are shown below.

Fig. 2: Demographic presentation of the clusters
Evidently the speed-oriented segment comprises mainly younger males, while females are more safety-oriented, and the comfort-oriented segment is on average somewhat older than the sample as a whole.


